In this post, we’ve gathered 24 mobile app usage stats, facts and projections you can use to make sure your own mobile app aligns with what your target audience is actually doing.
We’ve pulled research from the likes of ComScore, The Mary Meeker Report, Statista, App Annie, and more to bring you the numbers and insights that matter most.
Let’s get right to it.
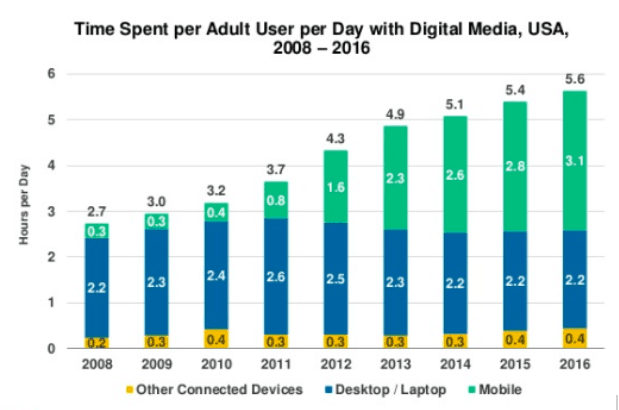
1. Desktop internet usage is falling & mobile internet usage is rising. (Mary Meeker)
According to the 2017 Mary Meeker report, the number of hours spent on the internet is still increasing each year, but the split between desktop and mobile is becoming more and more pronounced. In 2016, Americans were spending 3+ hours per day on mobile (that’s 10 times more than in 2008) and just 2.2 hours per day on a desktop or laptop (no change since 2008).
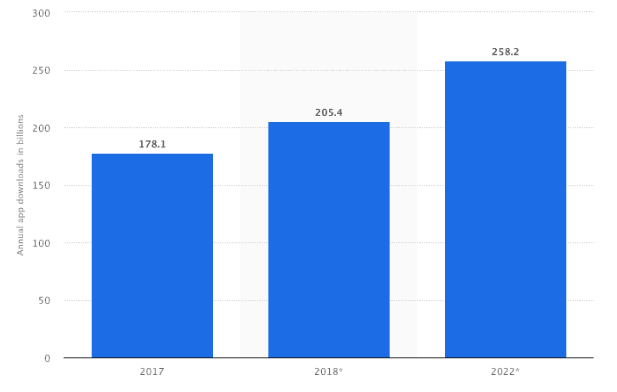
2. Consumers downloaded 178 billion apps in 2017—and that number is climbing. (Statista)
The number of mobile app downloads each year has been steadily increasing. In 2017, there were 178 billion app downloads. That number is projected to grow to 205 billion this year, and 258 billion in 2022—a 45 percent increase over five years.
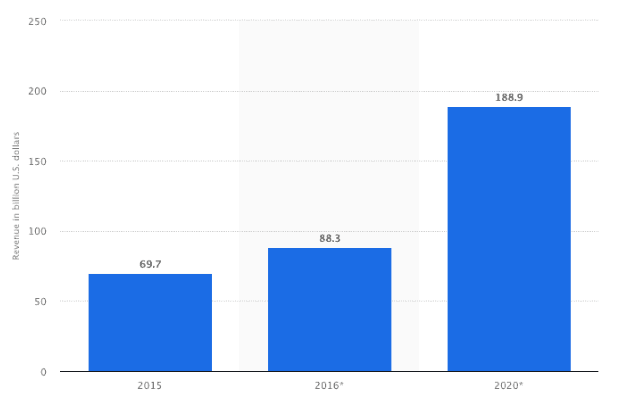
3. Mobile apps are projected to hit $188.9 billion in revenue by 2020. (Statista)
In 2016, the total revenue from mobile app downloads, advertising, and in-app purchases was $88 billion—this number is projected to pass $188 billion in 2020. A 113 percent increase over four years may sound crazy, but the numbers reflect that consumers are becoming more attached to their mobile devices and more comfortable making in-app purchases.
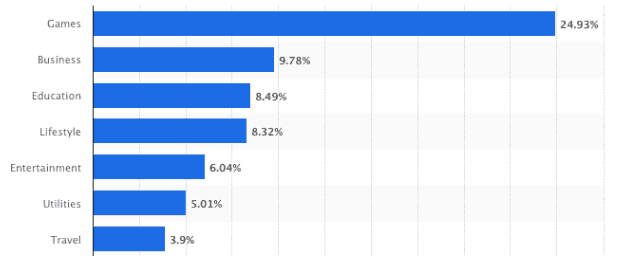
4. Nearly 25 percent of all mobile apps are game apps—2.5 times the number of business apps (Statista)
Of all the mobile apps in the Apple App Store, the most popular category for developers is gaming apps. Nearly 25 percent of all mobile apps fall into the games category. That’s 2.5 times more apps than the second-highest category (business) and 4 times more than entertainment, the fifth highest.
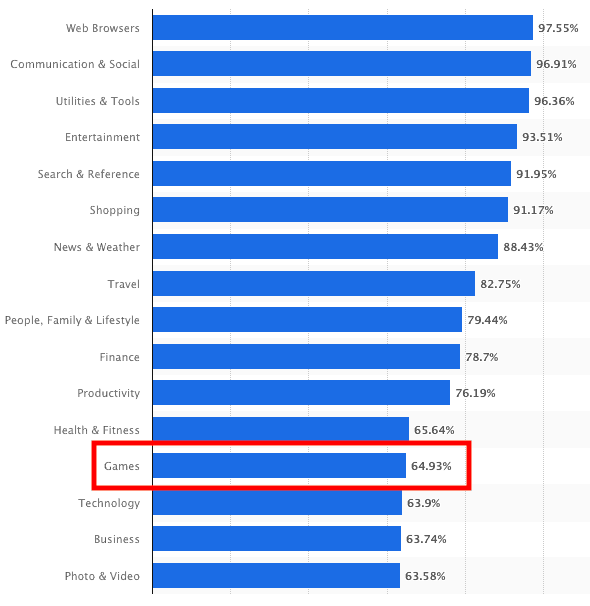
5. Only 65 percent of smartphone users have game apps on their phones. (Statista)
Although gaming apps are the most commonly created, only 65 percent of smartphone users have at least one game app on their device. In contrast, more than 90 percent of all smartphone users have a web browser, communication and social app, utility app, entertainment app, search app, or shopping app. Clearly the demand for gaming apps is not in line with the supply. While a number of these categories include apps that come pre-installed on new devices, the gaming category is still behind others like entertainment, shopping, lifestyle, and productivity.
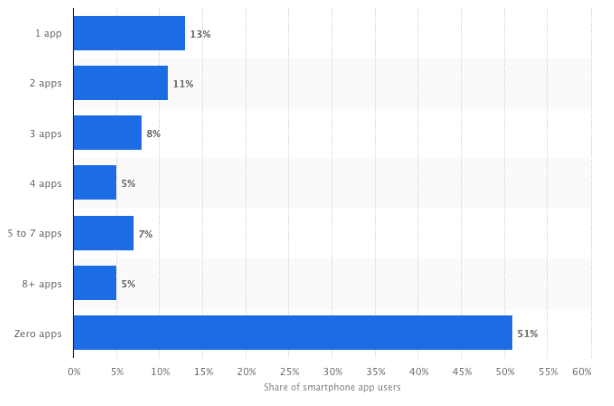
6. More than 50 percent of smartphone users in the U.S. download zero new mobile apps per month. (Statista)
Although the amount of time spent using mobile apps is increasing, more than half of all smartphone users in the U.S. said they downloaded an average of zero new apps per month in one quarter of 2017. Combine this with the number of people who downloaded one app per month, and you’ve got nearly two-thirds of all smartphone users downloading an average of one app or fewer every month.
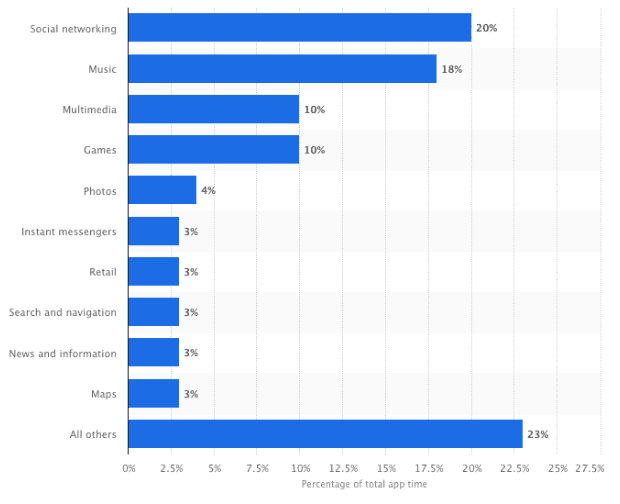
7. Smartphone users spend 38 percent of their mobile app time in social networking & music apps. (Statista)
When it comes to which mobile app categories smartphone users are spending the majority of their time in, social networking apps are on top at 20 percent of total usage time, and music apps, like Spotify and Apple Music, come in second at 18 percent.
8. After shopping online, 42 percent of consumers use a shopping app or communication app. (Statista)
When a smartphone user shops online—either in their web browser or in a mobile app—the next type of app they open is most likely to be a shopping app or a communication/social app. This suggests that users like to keep the momentum going and continue shopping, or go tell their friends about what they just bought.
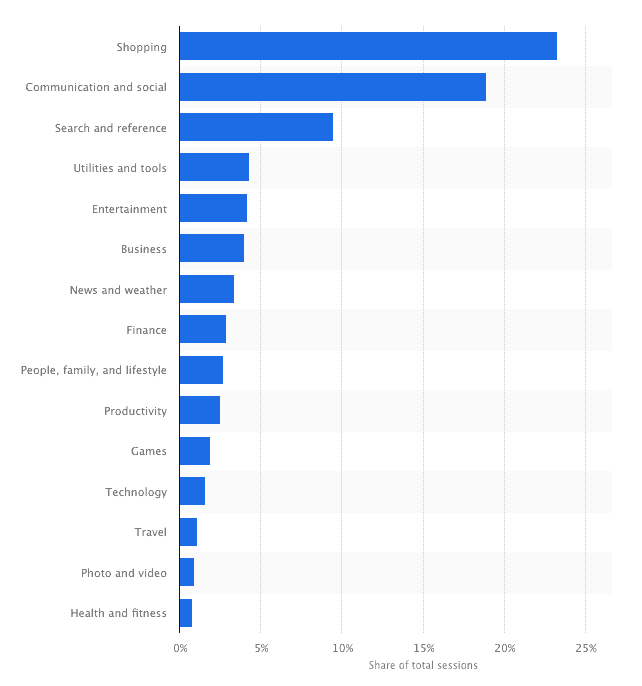
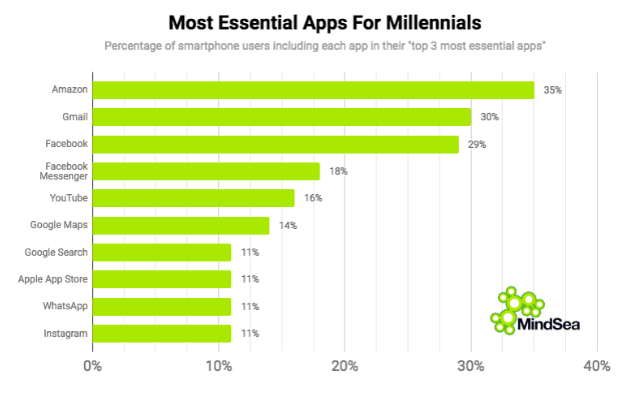
9. The top 3 mobile apps millennials can’t live without are Amazon, Gmail, and Facebook. (Business Insider)
When asked which mobile apps they felt were most essential, millennials most commonly answered Amazon, Gmail, and Facebook. With Amazon nabbing the top spot—above even Facebook, the largest social network in the world, and Gmail—it’s clear that this group is comfortable shopping on their mobile phones.
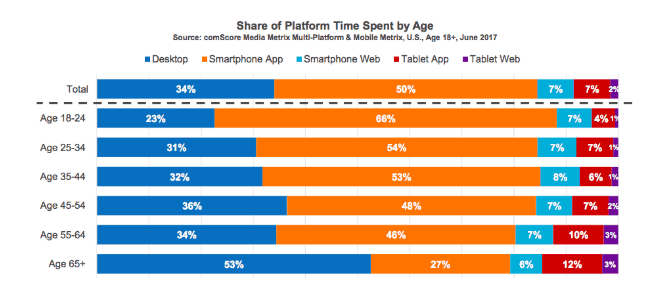
10. In 2017, 18- to 24-year-olds spent 66 percent of their digital media time using smartphone apps. (ComScore)
In terms of where they’re spending their digital media time each day, the younger demographics are far more likely to use a mobile device, while older groups are more likely to use a desktop. To take it a step further, people ages 18–44 are spending more than 50 percent of their digital time in mobile apps.
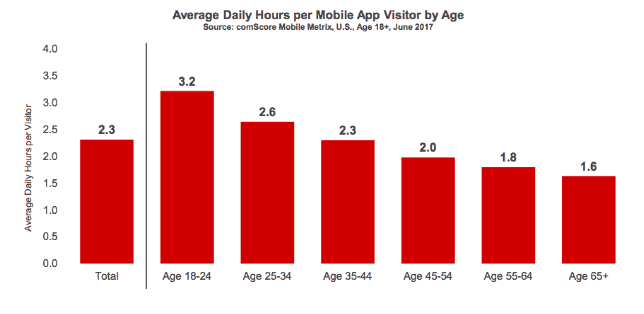
11. Younger smartphone users spend the most time on mobile apps. (ComScore)
The younger demographics are spending more hours using mobile apps than the older demos. The average 18- to 24-year-old spends more than three hours a day using the mobile apps on their phone while people 55 and older spend less than two hours.
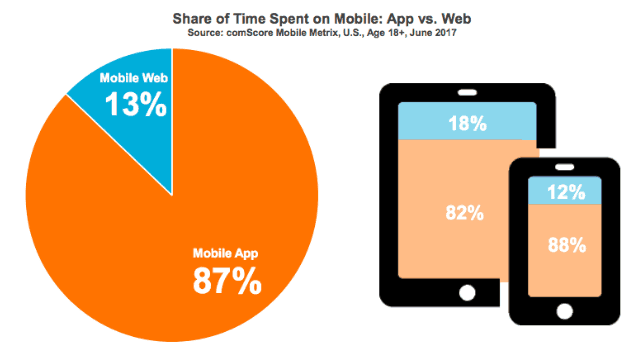
12. Mobile users are spending 87 percent of their time in apps, versus just 13 percent on the web. (ComScore)
The split between mobile app usage and mobile web usage is becoming more lopsided. In 2017, smartphone and tablet users spent 87 percent of their time in apps. This means that for every hour spent on the web, users were spending nearly seven hours using mobile apps.
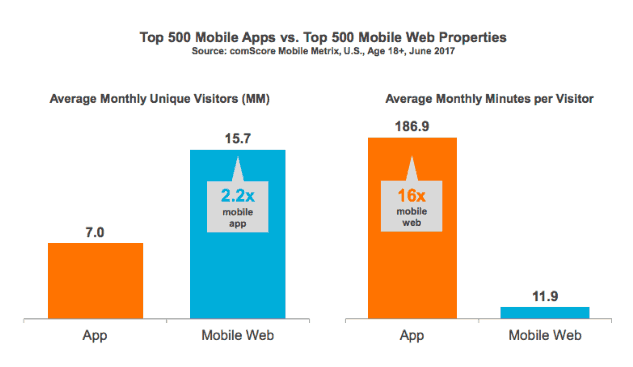
13. Mobile websites get more visitors than mobile apps, but visitors spend more time in apps. (ComScore)
In a comparison of the top 500 mobile apps and the top 500 mobile websites, the latter received 8.7 million more unique visitors per month. That said, the average number of minutes each visitor spent in mobile apps was 16 times higher than the number of minutes spent on the web.
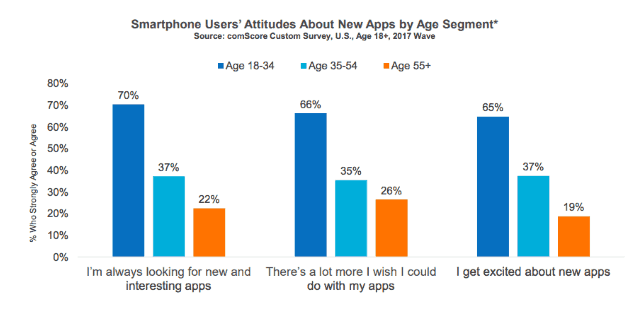
14. Millennials are three times more likely to be excited about new mobile apps and features than older users. (ComScore)
More than 2 out of 3 millennials say they’re always looking for new apps and wish they could do more with the apps they already have. In contrast, roughly 3/4 of mobile users 55 and older are not looking for new apps and seem to be satisfied with the functionality of the apps they have.
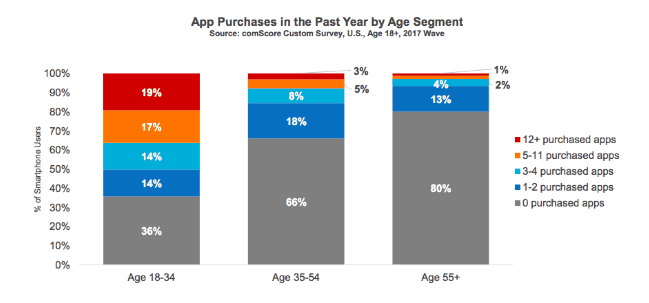
15. Millennials are more willing to pay for mobile apps, with 1/3 purchasing more than one per month. (ComScore)
In 2017, only 36 percent of millennials made zero app purchases the year before, while 80 percent of smartphone users age 55 and older did the same. During the same period, 36 percent of millennials purchased five or more apps, while just 3 percent of age 55+ users did the same.
16. In 2017, 46 percent of millennials made 5+ in-app purchases & 70 percent made more than 1. (ComScore)
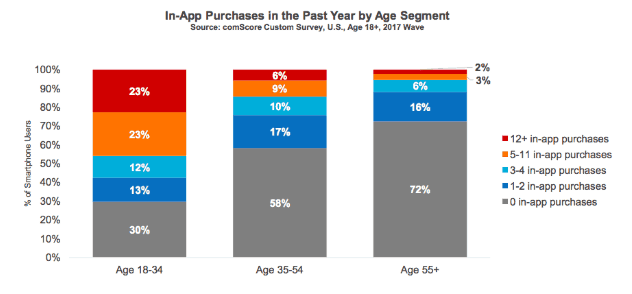
Just as millennials are more comfortable purchasing apps, they’re more comfortable making purchases within apps. Nearly half of all millennial smartphone users made five or more in-app purchases last year, while just 5 percent of age 55+ users did the same.
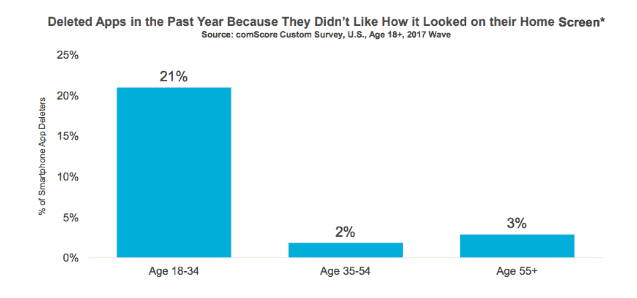
17. In 2017, 21 percent of millennials said they deleted a mobile app because they didn’t like the app logo. (ComScore)
According to ComScore, more than 20 percent of all millennial smartphone users say they’ve deleted apps simply because they didn’t like the way the logo looked on their screen. Functionality and benefits aside, if the color and design of your mobile app logo doesn’t fit the user’s expectations, the chances of your app being deleted will increase. We recently did a study on the role color plays in app designthat can help you get it right the first time.
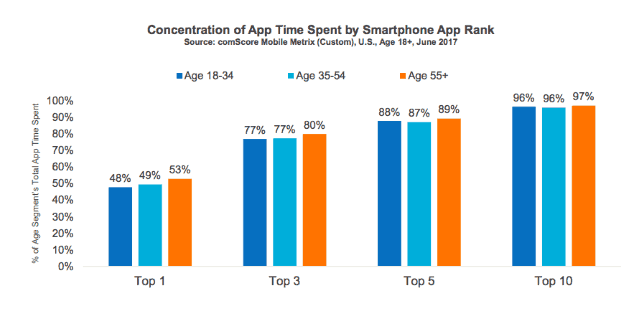
18. Smartphone users spend 50 percent of their time in one app & 97 percent in their top 10 apps. (ComScore)
As the time spent in mobile apps is increasing, the number of apps that smartphone users are actually opening and using is holding steady. In 2017, smartphone users were spending roughly 50 percent of their app usage time in a single app, and virtually all their app usage time in their top 10 apps.
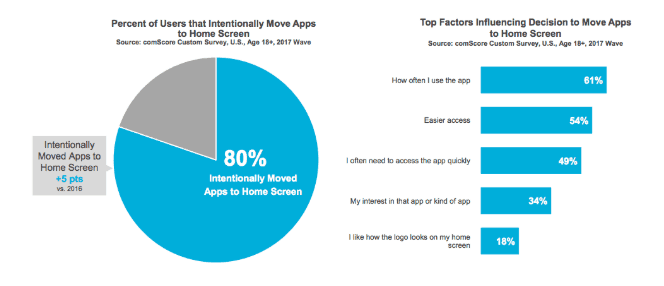
19. More than 50 percent of all smartphone users move mobile apps to the home screen for easy access. (ComScore)
In 2017, 80 percent of smartphone users said they had intentionally moved mobile apps to the home screen of their device. When asked why, 61 percent said it was because they use the app a lot, 54 percent said it was for easier access, and 49 percent said they often need to access the app quickly and don’t want to swipe through pages and folders. On top of the answers about easy access, 18 percent of users said they moved an app to their home screen purely because of how the logo looked—further demonstrating the importance of color theoryin mobile app icon design.
20. 76 percent of millennials say their phone is useless without mobile apps & 74 percent open an app when bored. (ComScore)
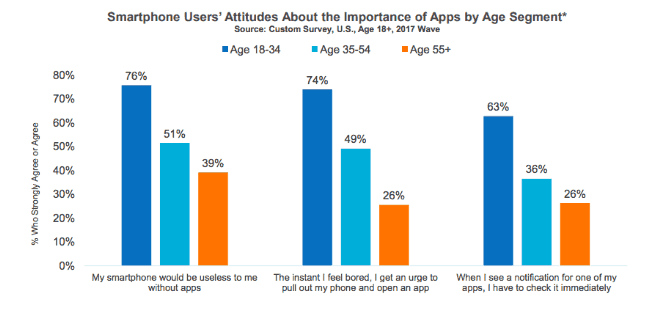
Millennials have become reliant not just on their mobile phones generally, but on the apps they’ve downloaded to their phones: 76 percent of millennials said their smartphones would be useless to them without mobile apps, and 74 percent said the instant they feel bored, they open an app on their phone. In addition, 63 percent of millennials say they click on new notifications right away.
21. The percentage of smartphone users that allow push notifications is up 16 percent from 2016. (ComScore)
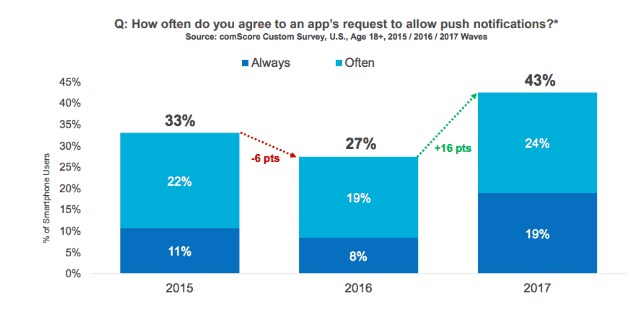
To build on the last key insight, smartphone users are also allowing mobile apps to send push notifications more frequently. From 2015 to 2016, the percentage of users who often allow notifications dropped from 33 percent to 27 percent, but that number rebounded 16 percent in 2017 to almost half of all total users.
22. Facebook and Google own 8 of the top 10 most used mobile apps in 2017. (ComScore)
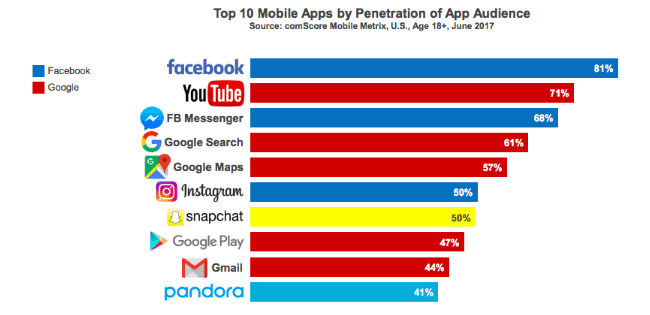
When it comes to the most popular smartphone apps, Facebook and Google are running the show. Of the top 10 most popular mobile apps, Facebook owns three and Google owns five; the other two are Snapchat and Pandora. More than 80 percent of all mobile phone users have the Facebook app installed on their device.
23. Nearly 40 percent of all smartphone users say social media apps are their most frequently used. (The Manifest)
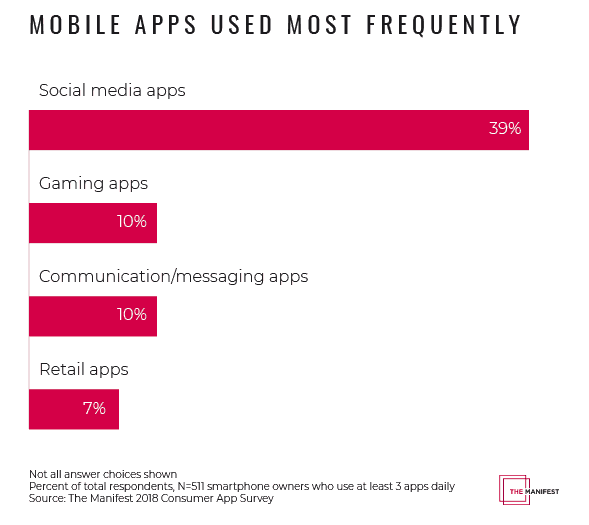
According to research from The Manifest, 39 percent of all smartphone users listed social media apps as their most frequently used, followed by communication apps and gaming apps at 10 percent apiece. In other words, roughly 50 percent of smartphone owners use their mobile devices first and foremost to connect with friends and family.
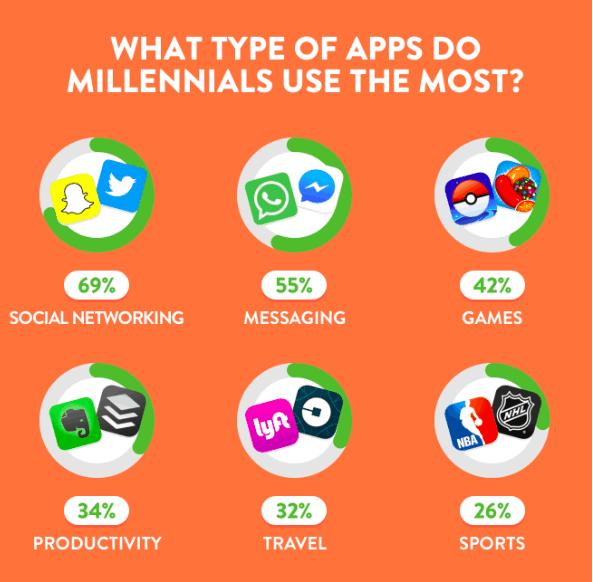
24. Nearly 70 percent of millennials say social networking apps are among their most commonly used. (MindSea)
Among millennials in particular, the number who list social media apps as their most frequently used category jumps to 69 percent, with messaging in second at 55 percent—further emphasizing the primary use of connecting and communicating with others.
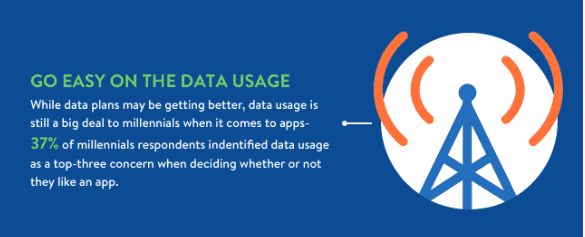
25. Roughly 37 percent of millennials list data usage as a key factor when deciding if they like a mobile app. (MindSea)
When asked what the top three factors are when deciding if they’ll keep a mobile app, 37 percent of millennials said excessive data usage was a dealbreaker for them. A perfect example of this is Pokemon Go—the app was a viral hit, but users were constantly frustrated with how much data it ate up, and many deleted it. As you’re building your own mobile app, keep in mind that high data usage may result in users hitting the delete button fast.
Now It’s Your Turn
Hopefully this post has helped you think a bit more critically about the direction you’re taking your own mobile app. Understanding what your audience is actually doing can be the difference between a mobile app that completely misses the mark and one that’s wildly successful.

